You are here: Home >> Graph Theory >> History of Graphs
In 1679 W. Leibniz writes to C. Huygens: "I am not content with algebra, in that it yields neither the shortest proofs nor the most beautiful constructions of geometry. Consequently, in view of this, I consider that we need yet another kind of analysis, geometric or linear, which deals directly with position, as algebra deals with magnitude".
In the original quote Leibniz uses the term "analysis situs" which means position analysis which was transformed to "geometria situs" or "geometry of position". Nowadays the same term indicates the Graph Theory.
 The Four Color Problem dates back to 1852 when Francis Guthrie, while trying to color the map of counties of England noticed that four colors sufficed. He asked his brother Frederick if it was true that any map can be colored using four colors in such a way that adjacent regions (i.e. those sharing a common boundary segment, not just a point) receive different colors. Frederick Guthrie then communicated the conjecture to DeMorgan. The first printed reference is due to Cayley in 1878.
A year later the first "proof" by Kempe appeared; its incorrectness was pointed out by Heawood 11 years later. Another failed proof is due to Tait in 1880; a gap in the argument was pointed out by Petersen in 1891. Both failed proofs did have some value, though. Kempe discovered what became known as Kempe chains, and Tait found an equivalent formulation of the Four Color Theorem in terms of 3-edge-coloring.
The next major contribution came from Birkhoff whose work allowed Franklin in 1922 to prove that the four color conjecture is true for maps with at most 25 regions. It was also used by other mathematicians to make various forms of progress on the four color problem. We should specifically mention Heesch who developed the two main ingredients needed for the ultimate proof - reducibility and discharging. While the concept of reducibility was studied by other researchers as well, it appears that the idea of discharging, crucial for the unavoidability part of the proof, is due to Heesch, and that it was he who conjectured that a suitable development of this method would solve the Four Color Problem.
This was confirmed by Appel and Haken in 1976, when they published their proof of the Four Color Theorem.
 The study of graphs is known as graph theory, and was first systematically investigated by D. Konig in the 1930s. Unfortunately, as Gardner notes, "The confusion of this term [i.e., the term "graph" to describe a network of vertices and edges] with the 'graphs' of analytic geometry [i.e., plots of functions] is regrettable, but the term has stuck." Some educators use the term "vertex-edge graph" for a connected set of nodes in an attempt to preserve the common usage of "graph" to mean the plot of a function.
In Mathematics and Computer Science, Graph Theory studies the properties of graphs. The term graph is used in Mathematics to mean a chart displaying numerical data, such as a bar graph. In Computer Science graphs are drawn using circles or large dots to denote objects.
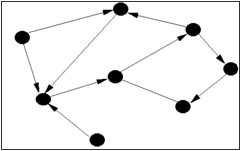
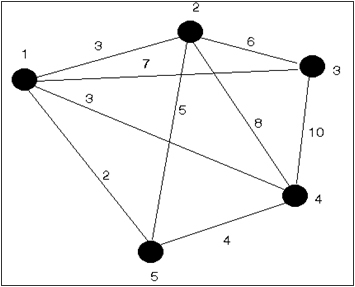
 Thus, a graph is a set of objects called vertices (or nodes) connected by links called edges (or arcs) which can be directed (assigned a direction). Typically, a graph is designed as a set of dots (the vertices) connected by lines (the edges). Lines indicate some sort of relationship between the objects.
Structures that can be represented as graphs are ubiquitous, and many problems of practical interest can be represented by graphs. The link structure of a website could be represented by a directed graph: the vertices are the web pages available at the website and there's a directed edge from page A to page B if and only if A contains a link to B. The development of algorithms to handle graphs is therefore of major interest in computer science.
A graph structure can be extended by assigning a weight to each edge. Graphs with weights can be used to represent many different concepts; for example if the graph represents a road network, the weights could represent the length of each road. Another way to extend basic graphs is by making the edges to the graph directional (A links to B, but B does not necessarily link to A, as in webpages), technically called a directed graph or digraph. A digraph with weighted edges is called a network.