You are here: Home >> Graph Theory >> Connection #1
Graphs are represented graphically by drawing a dot for every vertex, and drawing an arc between two vertices if they are connected by an edge. If the graph is directed the direction is indicated by drawing an arrow.
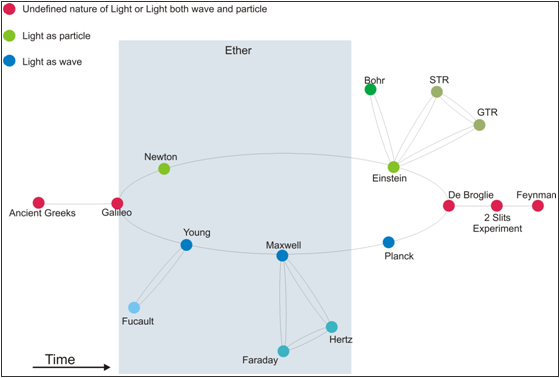
According to the previous definition we need a series of dots connected with arcs. First of all we need to represent time. To do so we have to sketch a timeline. This timeline will represent the facts through time. Each fact (or equally an idea, or the main representative of an idea) will be depicted by a dot on the main sketch. For the current study it is easier to replace certain facts with the name of famous scientists who backed a concept. The facts will be divided into three main categories:
"Green-ish' or "Blue-ish" dots illustrate ideas or representatives of ideas which tend to be identical to main representatives.
The main timeline below is also divided into two distinct curves. Each of these curves has to exist in order to portray the continuous scientific effort to understand the nature of light through time. Each curve represents a different notion of light. Considering that e.g. Newton and Young lived more or less the same period of time, the Graph Theory offers us a valuable tool to separate their scientific action by sketching the afore-mentioned curves.
Similarly, there are some dots (facts) which are also connected with other dots by curves e.g. Maxwell is connected with Faraday and Hertz by two smaller curves. This means that Maxwell was the main contributor of a fact (the wave nature of light on this occasion). However Faraday and Hertz provided significant help to this direction. Consequently, Faraday and Hertz could be conceptualized as "satellites" of Maxwell.
Last but not least, there is a grey area which represents the existence of ether in Physics. Since ether was an important concept it must be mentioned anyway.
